 BGS Data Catalogue
Fault geometry
Type of resources
Topics
Keywords
Contact for the resource
Provided by
Years
Formats
Representation types
Update frequencies
-
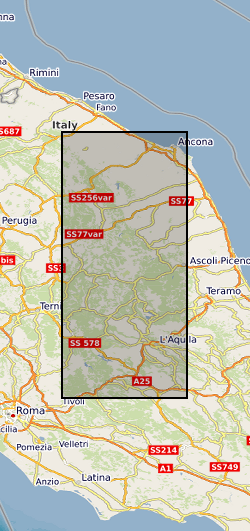
A set of six large catalogues documenting the seismic sequence that occurred in central Italy between 2016 and 2017, characterized by a cascade of four MW5.5–6.5 events. The earthquake catalogues possess different levels of resolution and completeness that result from progressive enhancements in both detection sensitivity and hypocentral location determination. These quality differences reflect the subsequent application of advanced methods.
-
Interpretations of fault positions, geometries and displacements, and seismic stratigraphic horizons. These are provided in the form of Seismic fault and horizon data as ‘Charisma fault sticks’ and ‘Charisma 2D interpretation lines’ ASCII files, respectively, exported from Petrel 2019. Additional CSV and XLSX files containing the compiled coordinate data are included. A readme file is also included explaining the contents of the different files and folders. Interpretations are from seismic profiles of the input oceanic plate section to the North Sumatra subduction zone. Results are published in: Stevens, D.E., McNeill, L.C., Henstock, T.J., Delescluse, M., Chamot-Rooke, N., Bull, J.M., 2020, Intraplate deformation offshore North Sumatra: New Insights from integration of IODP Expedition 362 results with seismic data. EPSL, 538, 116218.
-
Fault analyses used to estimate underlying dyke properties, imaged in 3D seismic reflection data. The seismic reflection data are located offshore NW Australia and image a series of Late Jurassic dykes and overlying dyke-induced normal faults; these structures occur within a sedimentary basin and are now buried beneath several kilometres of rock. The specific seismic reflection dataset used for this study so far is the Chandon 3D survey, which is freely available through https://www.ga.gov.au/nopims. Other 3D seismic surveys (e.g., Glencoe) near Chandon will be used in due course to extend the study area. Analyses of these faults uses an array of point pairs, defined by X, Y, and Z co-ordinates, that mark where certain sedimentary beds are intersected by the fault in its footwall and hanging wall. Mapping of these points every 125 m along each studied fault, for 11-14 sedimentary horizons, was conducted using Petrel seismic interpretation software. From the footwall and hanging wall point pairs, the throw, heave, displacement, and dip of each fault was calculated. By measuring distances between corresponding point pairs on opposing faults, graben width properties and estimated down-dip fault continuations were calculated. The expression of dyke-induced faults observed at the surface in active volcanic areas is often used to estimate dyke location, thickness (expected to roughly equal the heave on overlying faults), and upper tip depth (expected to occur where overlying, oppositely dipping faults meet; i.e. the point of the ‘V’). This study represents the first time natural dyke-induced faults and underlying dykes have been imaged in 3D and quantitatively studied. The dataset presented here allows hypotheses concerning relationships between dyke-induced fault geometries and dyke properties to finally be tested, and provides insight into normal fault kinematics; this will be useful to structural geologists and volcanologists.